
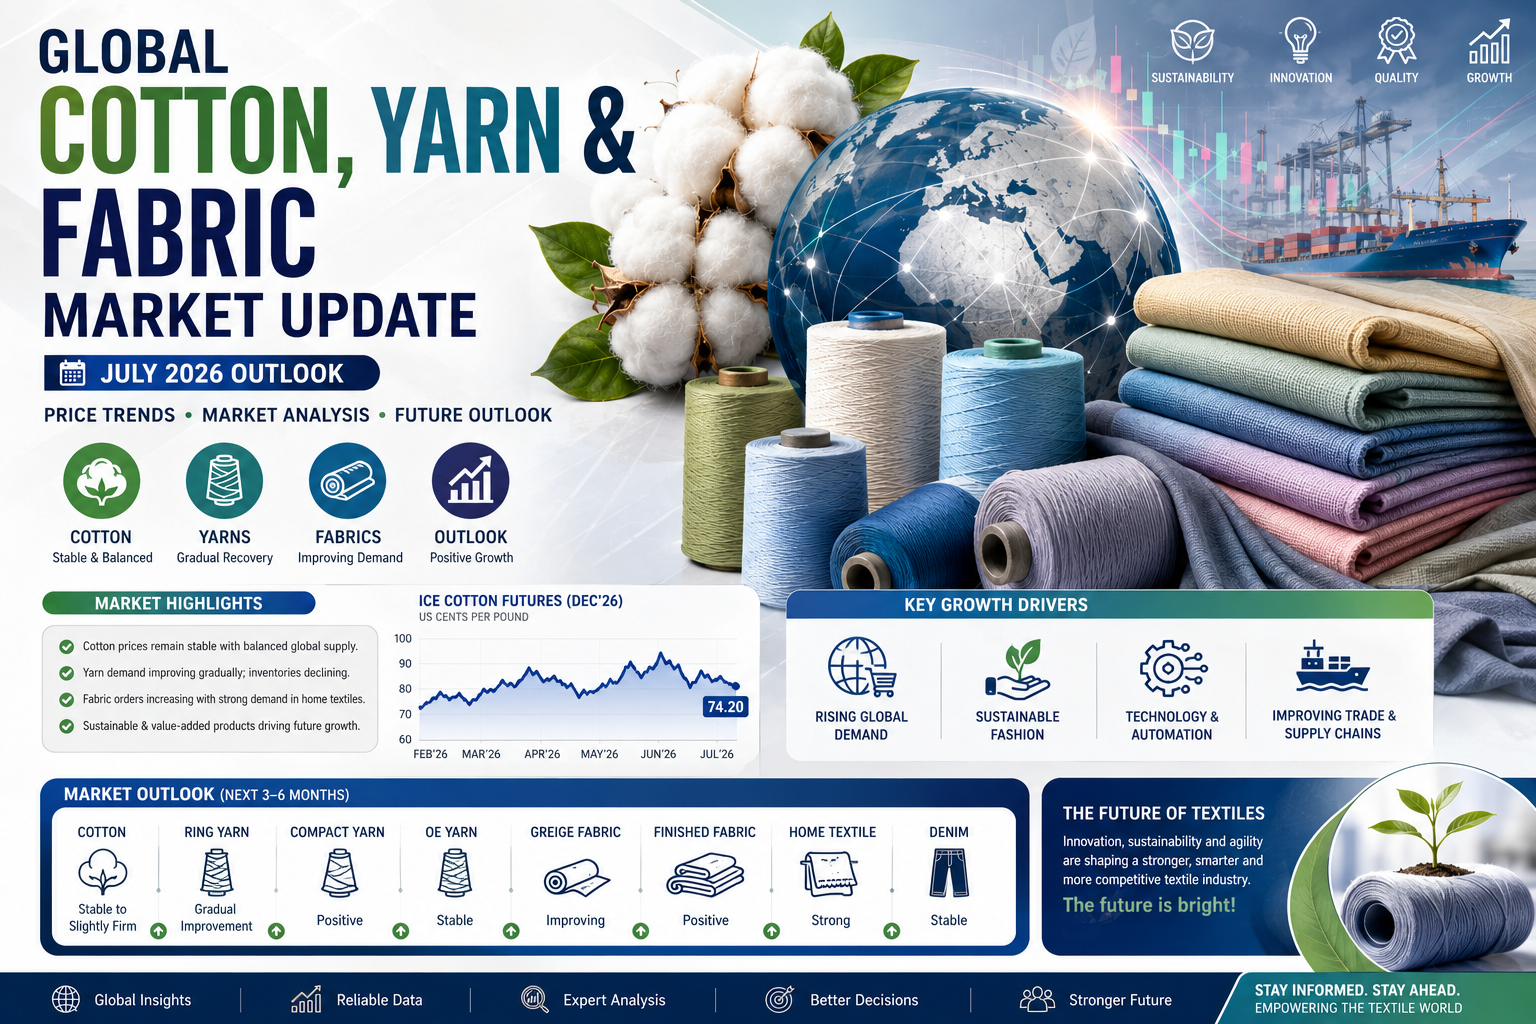
📊 Global Cotton, Yarn & Fabric Market Update – July 2026
By: Afzaal Khadim Khan
1. 🌍 Global Cotton Market Overview
1.1 USDA July 2026/27 Outlook
The USDA’s July report presents a market transitioning from surplus to deficit, with production forecasts slightly improved from June but still contracting year-on-year.
| Indicator | 2025/26 (Estimate) | 2026/27 (Forecast) | Change |
|---|---|---|---|
| Global Production | ~26.5M tonnes | 25.5M tonnes | ↓ 3.8% |
| Global Consumption | ~25.3M tonnes | 25.5M tonnes | ↑ 1.7% |
| Global Ending Stocks | ~1,650M tonnes | 1,551M tonnes | ↓ 5.9% |
Key revisions from June: Production was revised upward by 0.26 million tonnes, primarily from Brazil, Turkey, the US, and Uzbekistan. Consumption edged up by 40,000 tonnes, led by Vietnam .
The market is now firmly in a deficit position, with stocks-to-use ratios tightening—a structurally bullish signal for prices.
1.2 Major Country Breakdown
🇨🇳 China:
- Production: 7.29 million tonnes (↓6.4% YoY)
- Consumption: 9.04 million tonnes (↑1.2%)
- Ending stocks: 7.73 million tonnes (↓2.9%)
China remains the world’s largest importer, expected to account for ~19% of global cotton imports in 2026/27 after imports hit an eight-year low in the previous season. Additional import quotas and strong domestic prices are driving the recovery .
🇮🇳 India:
- Production: 5.23 million tonnes (↑0.8%)
- Consumption: 5.66 million tonnes (↑2.0%)
- Imports: ~1 million tonnes in 2025/26 (↑42%, a record high)
India has emerged as a surprise import powerhouse, driven by temporary import duty waivers and exemptions for extra-long staple cotton. The government’s ₹5,659 crore “Mission Kapas Kranti” aims to boost productivity over the next five years .
🇺🇸 United States:
- Production: 2.98 million tonnes (↑1.4% from June forecast)
- Ending stocks: 0.89 million tonnes (↓2.3%)
US production has been marginally revised upward due to improved weather conditions in key growing regions .
🇧🇷 Brazil:
- Production: 3.92 million tonnes (↓4% YoY, up 0.11M from June)
- Ending stocks: 0.74 million tonnes (↓10.4%)
Brazil has solidified its position as China’s largest cotton supplier, accounting for ~52% of China’s cotton imports .
🇦🇺 Australia:
- Production: 0.65 million tonnes (↓33.3% YoY)
Australia remains the most significant production casualty this season, contributing heavily to global supply tightness .
1.3 ICAC Price Outlook
The International Cotton Advisory Committee (ICAC) forecasts the Cotlook A Index for 2026/27 to range between 66–85 cents/lb, with a midpoint of 75.7 cents/lb .
Current Market Prices (as of July 2026) :
| Instrument | Price | Change (Since June) |
|---|---|---|
| Cotlook A Index | ~$1.503/kg | ↑ 3.5% |
| ICE Cotton Futures | ~81.6 cents/lb | ↑ 1.6% |
| China Cotton Index (3128B) | ~$1,770/ton | ↑ 0.3% |
| Zhengzhou Cotton Futures | ~$1,613/ton | ↓ 1.3% |
2. 🧵 Yarn Market Update
2.1 Cotton Yarn
India:
The cotton yarn industry is poised for a strong recovery in FY27 (2026/27) after a flat FY26. Revenue is projected to grow 9–11%, driven by:
- 6–8% improvement in yarn realizations
- 2–4% increase in volume
Export growth is expected to be the primary driver, with export revenue projected to rise 12–14%, increasing the share of exports in total revenue from 28% to 30–31%. Key markets include China and Bangladesh .
The cotton-yarn spread is expected to reach ₹108–110/kg in FY27, despite a 10–15% rise in cotton prices, supported by robust demand. Operating margins are projected to expand by 150–250 basis points to 11–12% .
Pakistan:
Cotton yarn exports rose 12.40% to $765 million in FY26 (July–June), a bright spot in otherwise flat textile exports .
2.2 Polyester Yarn (India)
July witnessed sharp price increases in the Indian polyester chain due to rising tensions around the Strait of Hormuz, which pushed crude oil and petrochemical feedstock costs higher .
| Product | Price (July 25, 2026) | Change |
|---|---|---|
| PTA | ₹93.90/kg ($0.98) | ↑ ₹6.30/kg |
| MEG | ₹58.70/kg ($0.61) | Upward trend |
| PSF | Increased by ₹3/kg | Effective July 25 |
| POY (126/34 SD) | ₹122/kg ($1.27) | ₹4/kg increase over week |
Buyer sentiment: Indian textile buyers remained cautious, making purchases largely on a need-based basis amid uncertainty over whether the sharp price hikes would sustain .
Polyester vs. Cotton Price Divergence:
While cotton prices have been supported by weather-driven supply concerns, polyester prices have fallen from their peak of ₹8,700/tonne to around ₹7,000/tonne as geopolitical risk premiums eased in mid-June. This has narrowed the natural-cotton-to-polyester price gap, potentially accelerating “substitution effects” in downstream consumption .
3. 👕 Fabric & Textile Market Update
3.1 Bangladesh: Major Policy Shift
The Bangladesh government has increased cash incentives for RMG manufacturers from 1.5% to 5% effective July 1, 2026, subject to mandatory local sourcing of yarn and fabrics .
Key Implications:
- Aims to revive the spinning sector, which has seen over 200 mills shut down in the past two years
- Expected to narrow the price gap between imported and locally produced yarn
- Imported yarn from India currently accounts for ~95% of Bangladesh’s yarn imports
BTMA Request:
The Bangladesh Textile Mills Association has also requested capping Free of Cost (FoC) fabric imports at 15% of prior-year export value (down from the proposed 50%), warning that the current proposal would cause “catastrophic losses” to domestic mills already operating below capacity due to high interest rates, energy crisis, and rising production costs .
3.2 Global Textile Trade Flows
Pakistan:
Textile exports for FY26 remained essentially flat at $17.93 billion (↑0.26%) .
| Category | FY26 Exports | YoY Change |
|---|---|---|
| Total Textile Exports | $17.93B | +0.26% |
| Readymade Garments | $4.288B | +3.87% |
| Cotton Yarn | $765M | +12.40% |
| Cotton Cloth | $1.672B | −7.55% |
| Yarn (non-cotton) | $29.3M | −13.92% |
June 2026 was particularly weak, with textile exports falling 16.71% YoY to $1.267 billion .
Global Context:
- Asia-Pacific retained 54% of global textile output in 2025, anchored by integrated Chinese clusters and Bangladesh’s low labor costs
- Vietnam captured diverted US orders under the UFLPA, posting 18% YoY export growth in H1 2025
- Europe is pivoting to high-value technical textiles due to the Carbon Border Adjustment Mechanism (CBAM)
4. 📈 Views on Market Changes
4.1 Factors Behind Recent Market Shifts
| Driver | Impact |
|---|---|
| Global Supply Tightening | Global production down 3.8% YoY; stocks at 8-year lows |
| India’s Surge in Imports | Record imports (↑42%) driven by duty waivers |
| China’s Import Recovery | Returning as largest importer (~19% share) |
| USDA July Revision | Production improved (Brazil, US, Turkey) but deficit remains |
| Polyester Price Drop | Natural vs. synthetic gap narrowing; substitution risk |
| Geopolitical Risk (Hormuz) | Spiked polyester prices; energy cost volatility |
| Bangladesh Policy Shift | Higher incentives linked to local sourcing |
4.2 Price Outlook
Bullish Factors:
- Continued global stock drawdown (stocks down 5.9% YoY)
- Australia’s 33% production collapse
- Strong import demand from India and China
- Yuan depreciation making Chinese exports more competitive
Bearish Factors:
- Polyester still 30–40% cheaper than cotton; substitution risk in apparel
- US production recovery from improved weather
- Weaker June exports from Pakistan (-16.71% YoY)
- Consumer demand in the US and Europe remains fragile
5. 🔮 Potential of the Textile Sector – Near Future Outlook
5.1 Growth Projections
The global textile market is projected to expand from $0.79 trillion in 2026 to $1.02 trillion by 2031, growing at a CAGR of 5.09% .
Segment Growth Rates:
- Fashion & Apparel: ~56% of demand, moderate growth
- Industrial/Technical Textiles: Fastest growth at 6.15% CAGR (automotive airbags, medical textiles, protective workwear)
5.2 Key Opportunities
| Opportunity | Description |
|---|---|
| India’s “Mission Kapas Kranti” | ₹5,659 crore, 5-year program to boost cotton productivity; should raise yields and improve quality |
| Bangladesh Local Sourcing Push | 5% cash incentive for local sourcing could revive the spinning sector and create domestic value addition |
| China’s Import Demand | Returning as top importer; Brazil and Australia suppliers |
| Cotton-Yarn Spread Recovery | Expected ₹108–110/kg in FY27; operating margins to improve |
| AI & Digital Traceability | EU Digital Product Passport by 2027; $1.45B investment in traceability tech |
5.3 Risks to Monitor
| Risk | Potential Impact |
|---|---|
| El Niño / Climate Risk | Could disrupt 2026/27 production in major growing regions |
| Strait of Hormuz Tensions | Energy-driven polyester price volatility |
| US-China Trade Relations | UFLPA enforcement diverting supply chains; tariffs could affect demand patterns |
| LDC Graduation (Bangladesh) | Duty-free access ends in 2029; competitiveness at risk without productivity gains |
| Consumer Cost-Consciousness | Fast fashion and second-hand market gaining share; premium sustainability segment still niche |
📝 Summary
July 2026 marks a pivotal point in the global cotton and textile cycle. The cotton market is shifting decisively from surplus to deficit, with stocks hitting eight-year lows. India’s emergence as a surprise import powerhouse and China’s return to the global import market are reshaping trade flows .
The polyester-cotton price divergence—with cotton supported by supply fears and polyester dropping on easing geopolitical risks—has reopened the “substitution window,” creating a key variable to watch heading into the new crop season .
On the policy front, Bangladesh’s bold move to tie export incentives to local sourcing represents a structural shift that could revitalize its spinning sector if effectively implemented . India’s five-year “Mission Kapas Kranti” and duty waivers indicate a proactive government stance to ensure raw material availability and boost domestic value addition .
The near-term outlook remains cautiously optimistic, with yarn margins and exports expected to improve in FY27, provided climate and geopolitical risks do not escalate .
This report is based on data available as of July 27-29, 2026. Sources include USDA, ICAC, PBS Pakistan, CRISIL, BTMA, and trade reports.